Friday, July 24, 2026

Airfoil Tools: Aerodynamics software for analyzing isolated airfoils and multi-element airfoils in subsonic, transonic and supersonic flows

How I Developed a Suite of Airfoil Tools


Hanley Innovations airfoil software suite was developed progressively, with each new tool building on and verifying the previous step. The objective was to create a modern set of user-friendly airfoil analysis tools for engineers, designers, and students.

Step 1. Develop an airfoil analysis method using a linear-strength panel method combined with a practical stall model. This provided a fast foundation for calculating pressure distributions, lift, drag, and pitching moment over a useful range of operating conditions.

Step 2. Integrate the Step 1 solver into an interactive multi-element airfoil tool. This extended the analysis to configurations containing flaps, slats, and multiple lifting elements while retaining the speed and simplicity of the original method.

Step 3. Develop a graphical interface using an O-grid and an Euler solver based on the Van Leer flux-vector-splitting method. This provided a compressible-flow capability and allowed the panel-method results to be compared with a higher-fidelity numerical solution.

Step 4. Apply the multi-element workflow from Step 2 to an Euler solver using the Van Leer method and a Cartesian grid. The Cartesian-grid approach simplified grid generation and provided a practical path for analyzing more complicated airfoil arrangements.

Download VisualFoil NACA Free ➡️ 

The overall development strategy was deliberately incremental. Each stage added a new capability while providing an opportunity to verify the calculations against the earlier methods. The result is a related suite of tools covering rapid preliminary analysis, multi-element configurations, compressible flow, and Cartesian-grid CFD.

Learn more ➡️ https://www.hanleyinnovations.com

Wednesday, July 22, 2026

eVTOL Transition Analysis and Aerodynamics


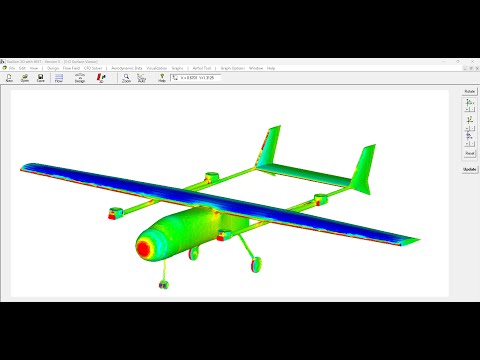
A recent Stallion 3D study examined the NASA RAVEN-SWFT OpenVSP model as a 1,000-pound aircraft transitioning in forward flight while retaining its six vertical rotors.

The preliminary cases covered 7, 20, 40, and 60 m/s. Stallion 3D calculated aircraft lift, drag, moments, individual rotor power, total rotor power, and the aerodynamic power required to overcome drag. The resulting tables provide a simple baseline for transition as a hexacopter.

What the Initial Sweep Shows

At low speed, most of the required power is associated with the lifting rotors. As speed increases, rotor power decreases while drag multiplied by speed increases rapidly. Several rotors also begin to autorotate in edgewise flow. This indicates that a practical transition schedule must include rotor unloading, tilt, shutdown, braking, feathering, or another method of controlling the rotor state.

The all-vertical case is not presented as the optimum solution. It is a minimum-viable baseline. The next step is to vary proprotor angle, rotor grouping, aircraft attitude, and shutdown strategy. A small number of CFD cases can first identify the useful region of the design space. More expensive cloud or high-performance computing can then be applied to optimize the promising configurations rather than search blindly.

This is the gap Stallion 3D is intended to fill: establish a credible aerodynamic and propulsion plant model early, use real forces and moments to remove poor transition concepts, and reserve large computing budgets for the designs that justify further study.

View the Tables and Transition Graph

About Stallion 3D

Stallion 3D bridges the gap between low-fidelity panel methods and expensive CFD algorithms that run in remote data centers. It was developed to efficiently solve aerodynamic problems and deliver high-fidelity RANS solutions securely on your Windows 10/11 computer. Stallion 3D imports actual designs, automatically generates the volume grids and computes real-world solutions. Use it to verify conceptual designs across subsonic, transonic and supersonic Mach numbers.

Learn more➡️ 

Hanley Innovations
Stallion 3D Aerodynamics Software
www.hanleyinnovations.com


Thursday, July 9, 2026

Soccer Skills: The Aerodynamics of a Bending Soccer Field Goal


Aerodynamics of a Soccer Ball Transcript

Welcome to Bend It Like Stallion 3D. The aerodynamics of a spinning soccer ball.

The colored surface represents the local flow speed around the ball, while the streamlines show how rotation changes the wake behind the ball. Because the ball is spinning, the air flow becomes asymmetric, producing a pressure difference across the surface. This pressure difference generates a lateral force that curves the trajectory during flight.

In this example, we examine the aerodynamics of a regulation soccer ball traveling at 67 mph. The ball is spinning at 600 revolutions per minute or 10 hertz to produce a side force across the soccer pitch.

The purpose of the simulation is to predict the Magnus effect and figure out the magnitude responsible for a bending free kick.

  • To start the simulation in Stallion, we import the STL file of the ball.
  • Next, we set the speed, flight angle, and sea level conditions.
  • Then, we set the rate of rotation to 10 herz and the normal vector to the desired spin direction.
  • Finally, we click the menu to generate the grid and solve the flow.

For this case, Stallion 3D predicted approximately 5.8 Newtons of drag and 5.7 Newtons of side force. These values are consistent with the expected aerodynamic behavior of a spinning soccer ball and demonstrate the software's ability to capture rotational flow effects.

Surface pressures, force components, and aerodynamic moments are computed directly from the Navier Stokes solution. Although this example features a soccer ball, the same numerical methods are used to analyze aircraft, UAVs, rockets, and EV2L vehicles, and of course, a real football as well 😀  By changing the geometry and the operating conditions, Stallion 3D can predict the aerodynamic forces and moments required for engineering design and stability analysis.

Please visit https://www.hanleyinnovations.com to learn more about Stallion 3D

Monday, June 29, 2026

Bend it like Stallion 3D. FIFA Inspired Aerodynamics Simulation ⚽🥅


A soccer ball was simulated in Stallion 3D at 67 mph (30 m/s) with 600 rpm (10 Hz) of spin to examine the Magnus effect responsible for a bending free kick.

The  Stallion 3D simulation predicted the following forces:
• Side Force: 5.72 N (1.29 lb)
• Total Drag: 5.70 N (1.28 lb)
• Lift: −0.333 N

The streamlines, in the attached side-view picture, show the wake generated by the spinning ball, producing the lateral force that curves the trajectory.  Although simple in appearance, predicting this behavior requires resolving the interaction between boundary-layer separation, rotation, and wake development around the ball.  Similar dynamic inputs into Stallion 3D are often used to accurately compute dynamic and damping derivatives for airplane, UAVs and eVTOLS stability and control. 

Sometimes CFD predicts an aircraft. Sometimes it predicts a free kick.

Learn more ➡️ https://www.hanleyinnovations.com

Thursday, June 18, 2026

eVTOL Aerodynamics: Use Stallion 3D for Early eVTOL Concept Analysis. Compute lift, drag, moments and ideal power


This is a Stallion 3D near-hover simulation of the NASA RAVEN SWFT, a 1,000 lb eVTOL concept, at 7 m/s forward speed. The model includes six lifting rotors with pressure plotted on the aircraft surfaces and actuator disks. The pressure scale shown is approximately 100,950 to 101,450 Pa.

The computed surface forces are: lift = -86.31 N (-19.40 lbs), side force = -3.08 N (-0.693 lbs), pressure drag = 57.65 N (12.96 lbs), friction drag = 4.65 N (1.04 lbs), and total drag = 62.30 N (14.01 lbs). The related force components are FX = 57.65 N, FY = -3.08 N, and FZ = -86.31 N. The moments about the reference CG are pitch = 175.38 N-m, roll = -1.23 N-m, and yaw = -9.74 N-m.

The ideal rotor power from the six disks is 7,059.38 W, 7,065.66 W, 6,310.21 W, 6,314.22 W, 10,189.09 W, and 10,231.14 W, for a total ideal power of 47,169.70 W. This is a simple near-hover CFD check, but it shows the type of integrated aircraft, rotor, pressure, force, moment, and power information that can be reviewed directly inside Stallion 3D.

Performing early 3D aerodynamics analysis using accurate and accessible software ensures stable first flights. 

Please use the link be low to learn more about Stallion 3D.

➡️ https://www.hanleyinnovations.com 

Learn the Background Story about my CFD and Aerodynamic Software Business


I recently had the chance to talk with Roopinder at ENGtechnica on YouTube about aerodynamics, CFD, and some of the practical work behind Hanley Innovations.

The discussion is a good plain-English overview of how I think about simulation, aircraft design, and engineering software. It is a technical conversation about real aerodynamics, useful calculations, and the role of CFD in understanding what an aircraft actually sees.

Please let me know if you have any questions. 

To learn more about Hanley Innovations please visit https://www.hanleyinnovations.com.

Best regards,

Patrick.

Sunday, May 31, 2026

Breaking the Sound Barrier: Shock Waves, Drag Rise, and the Physics of Transonic Flight

Why is it so difficult for aircraft to fly near Mach 1?


In this short video, I use Stallion 3D to look at transonic flow around an aircraft. The example starts with the Bell X-1, the first aircraft to break the sound barrier in 1947. The main idea is simple: as an aircraft approaches the speed of sound, the airflow does not change smoothly. The drag can rise sharply.

This speed range is called the transonic regime. In transonic flow, part of the air around the aircraft can still be subsonic, while another part has already become supersonic. This can happen directly on the surface of the aircraft. That is what makes the problem important for aircraft design.

When shocks form on the aircraft surface, the pressure distribution changes quickly. The forces on the airplane are found by adding up the pressure over the surface. If the pressure changes sharply before and after a shock, the aircraft can see a large increase in drag. This is one reason wave drag becomes important near the speed of sound.

The flow can also become unsteady. A shock wave may move back and forth on the aircraft surface. That motion can create unsteady aerodynamic forces. In some cases, those forces can contribute to structural vibration or other design problems.

One common way to reduce transonic drag is to sweep the wing. Wing sweep reduces the effective Mach number seen by the airfoil section and helps delay some of the strongest transonic effects. This is one of the reasons swept wings became common on fast aircraft. The video is a simple look at this problem using Stallion 3D CFD.

More information can be found at Hanley Innovations ➡️ https://www.hanleyinnovations.com 

Thanks for watching

Patrick 

Friday, May 8, 2026

Transonic Aircraft Design and Analysis

Transonic Accuracy with Stallion 3D

Transonic aircraft design is difficult because small changes in sweep, airfoil shape, angle of attack, and Mach number can produce large changes in pressure distribution and drag. Stallion 3D is designed to capture these effects with high-fidelity CFD, giving engineers a practical way to compare configurations before committing to expensive testing or redesign. In the example (see above picture), two similar wings with the same span, chord, aspect ratio, and area show very different drag results at Mach 0.85, demonstrating how sweep can strongly influence transonic performance.

This level of differentiation is important for CCA UAVs, small business jets, rockets, and other high-speed vehicles operating near or through the transonic regime. Stallion 3D can help identify how design choices affect shock behavior, pressure drag, skin friction drag, and aerodynamic loading. The goal is not just to create colorful flow images, but to produce useful aerodynamic forces, moments, and coefficients that guide design decisions.

The accuracy edge of high-fidelity CFD comes from resolving the physics well enough to separate meaningful design differences. For transonic aircraft, that means being able to evaluate sweep, airfoil selection, angle of attack, and geometry changes with confidence. Stallion 3D gives small teams and engineering groups a way to bring this type of analysis into early design trade studies, where better aerodynamic answers can reduce risk and improve the final vehicle.

Please visit the following link for more information about Stallion 3D:

➡️ https://www.hanleyinnovations.com

As always, feedback is welcome.  Thank you.


Best regards,

Patrick

Saturday, May 2, 2026

eVTOL Aerodynamics - How to analyze an aircraft in the cruise configuration with 6 prop rotors.


Follow the step to compute lift, drag, aerodynamic moments and induced power for the eVTOL cruise configuration.


  1. Here is the breakdown on how to analyze an eVTOL aircraft using Stallion 3D.
  2. Click the design menu to import the STL geometry.
  3. Next, choose the eVTOL CAD file. The STL file can be either ASCII or binary.
  4. In the position tab, choose STL location to place the geometry to the exact design coordinates.
  5. Set the dimensions in the size scale tab. Be sure to click the box to set up the automatic grid sizing. Then click okay.
  6. Click design menu and top view and visualization view geometry to verify the design was correctly imported. To model prop wash and compute the ideal power, we can add six actuator discs.
  7. Click the actuator discs menu.
  8. Start with the inboard starboard propeller. Enter thrust location, direction, inner and outer disc radii.
  9. Choose linear thrust distribution.
  10. Click copy and then add disk.
  11. In the disk 2 dialogue, click paste to fill the box with the copied information.
  12. Change only the Y center of rotation sign to negative to create the inboard port rotor disc.
  13. Click add disc to continue the process.
  14. Enter the information for the outboard starboard prop rotor.
  15. Copy and paste to the port rotor and change the sign of the Y center of rotation to negative.
  16. Complete the process for both the starboard and port tail prop rotors.
  17. Run the CFD with a target cell count of over 1 million cells.
  18. At sea level conditions, set the angle of attack to 2.5° and the speed to 200 mph.
  19. The results show a combined power of 360 kW for the speed and angle of attack settings.
  20. In addition, the lift to drag ratio is 13.2. Learn more at hanleyinovations.com.

Please visit https://www.hanleyinnovations.com for more information.

Sunday, February 22, 2026

A Strategy for Faster Aerodynamics Analysis using Stallion 3D

Solving Half-Geometry Models in Stallion 3D Using Symmetry

In many aerodynamic problems, the geometry is symmetric about a plane. When this is the case, the computational model can be reduced to half the physical geometry. This approach either:

  • Increases solution resolution for the same computational cost, or
  • Reduces runtime by approximately 50% while maintaining resolution.

This short example demonstrates how to apply symmetry in Stallion 3D for a full aircraft configuration.

Purpose of Half-Model Analysis

When symmetry exists:

  • The flow physics are mirrored across a plane.
  • Only half the domain must be solved.
  • Grid density can be increased for the same memory footprint.
  • Turnaround time is reduced without sacrificing accuracy.

This is especially useful for:

  • Conceptual aircraft design
  • Wing-body configurations
  • Early trade studies
  • Parametric geometry comparisons

Step-by-Step Workflow

Step 1 – Import the STL Geometry

  1. Go to Design → Import STL
  2. Load the aircraft geometry.
  3. Confirm the orientation and scale.

If you intend to use symmetry, only half of the geometry needs to be present (aligned with the symmetry plane).

Step 2 – Define the Computational Boundaries

  1. Select Size / Scale
  2. Set the CFD boundaries relative to the STL geometry.
  3. Leave default settings unless refinement is required.
  4. Click OK

The boundaries should extend sufficiently far from the geometry to prevent artificial blockage.

Step 3 – Inspect the Geometry

Use either:

  • Visualization → View Geometry Only, or
  • The wireframe view in the Design window

Verify:

  • No unintended gaps
  • Proper orientation
  • Symmetry plane alignment at Y = 0 (or your chosen plane)

Step 4 – Configure the CFD Solver

Navigate to CFD Solver → Setup CFD Solver.

Recommended starting settings:

  • Approximately 1,000,000 cells
  • Initial X, Y, Z divisions appropriate to domain size
  • Enable near-body refinement splitting

Confirm:

  • RANS (Reynolds-Averaged Navier-Stokes) model selected
  • Turbulence model appropriate for your case

Click OK.

Step 5 – Apply the Mirror Boundary Condition

This is the key step.

  1. Select Ground Effect → Mirror Image
  2. Choose Mirror at Minimum Y
  3. Click Apply
  4. Go to the Dimensions tab
  5. Set Minimum Y = 0

This aligns the lower boundary with the symmetry plane. Stallion 3D reflects the solution across that plane internally.

Step 6 – Verify the Mirror Setup

Return to the geometry view. You should observe:

  • The physical half-geometry
  • A mirrored computational image
  • A symmetry plane replacing the removed half

Step 7 – Generate Grid and Solve

  1. Go to CFD Solver
  2. Select Generate Grid and Solve Flow

After the solver converges (for example, ~4,000 iterations in this demo), the pressure field will be available for post-processing.

The solution shows pressure distribution on the physical half, with the symmetry plane replacing the opposite side, providing a full aerodynamic solution at roughly half the computational expense.

Step 8 – Extract Pressure Coefficient (Cp) Slices

Use surface graphs and spanwise Cp slices to compare stations across the wing. Example span stations:

  • y = 3 m
  • y = 4 m
  • y = 5 m

These results are commonly used for load integration, structural sizing input, performance analysis, and validation against reference data.

Why This Matters

Using symmetry correctly enables faster iteration during early design, higher resolution grids within memory limits, and efficient conceptual evaluation of aircraft configurations. For UAV designers and small engineering teams, this can significantly reduce turnaround time while preserving fidelity.

Summary

To solve half-geometry models in Stallion 3D:

  1. Import STL
  2. Define CFD boundaries
  3. Set solver parameters
  4. Apply mirror boundary at the symmetry plane
  5. Generate grid and solve
  6. Extract aerodynamic data

The same method applies to wings, fuselages, hydrofoils, and other symmetric configurations.


For more information, visit: hanleyinnovations.com

Monday, February 16, 2026

Pre-Conceptual Design Process using Stallion 3D CFD for Fast Aerodynamics & AI for Geometry Iterations


Vibe-Coding a Bell X-1 Concept with AI CAD + Fast CFD

This note summarizes a simple workflow: use AI to generate “good enough” concept geometry quickly, then use fast CFD to compare design directions before investing time in detailed CAD. The example is a Bell X-1 inspired aircraft concept, created using AI-generated FreeCAD Python, then assessed with Stallion 3D.

Why this matters

Early design decisions are usually made with incomplete information. The goal is not perfection; the goal is to narrow the field of choices quickly. AI-based geometry generation helps you create a plausible 3D model from a written description. Fast CFD then helps you identify the obvious wins and losses (trim tendencies, pressure loading trends, interference hot spots, tail authority risk, etc.) before committing to a “real” CAD model.

What was built

The target look and approximate dimensions were based on the Bell X-1. The aerodynamic surfaces were assigned common airfoils to make the concept testable:

  • Wing: NACA 2412
  • Horizontal tail: NACA 0012 at -5 degrees incidence
  • Vertical tail: NACA 0006

The Gemini prompt used (and why it worked)

The prompt used in Gemini was:

“can you write the python for freeCAD for an aircraft that has the looks and dimensions of the Bell X-1 but the wings has a NACA 2412 airfoil. The horizontal tail has the 0012 at -5 deg insizence. The vertical tail has naca 0006.”

This prompt contains three useful elements:

  1. A recognizable reference: “Bell X-1” is a strong anchor for proportions and overall arrangement.
  2. Explicit aerodynamic definitions: specifying airfoils and tail incidence prevents the geometry from being “just a shape” and makes it a legitimate candidate for early aerodynamic checks.
  3. A clear output format: “python for FreeCAD” strongly constrains the response to something executable.

If you want even more consistent results, add a few practical constraints to the prompt:

  • State span, chord, tail spans, and approximate fuselage length (numbers reduce ambiguity).
  • Ask for a single script that builds solid bodies (not only surfaces) when possible.
  • Ask the script to group parts into named objects (Wing, Tail, Fuselage) for easy editing.
  • Request parameters at the top of the script so you can “tune” dimensions without rewriting code.

Suggested workflow: AI CAD → quick cleanup → early CFD

1) Generate concept geometry quickly

Use AI to produce a FreeCAD Python script that creates the fuselage and lifting surfaces. Do not overfit details. At this stage, you are trying to capture the overall layout (wing position, tail volume, fuselage shape, and incidence angles) well enough to learn something from analysis.

2) Sanity-check geometry (do not “CAD-polish”)

Typical quick checks:

  • Are the wings/tails located where you intended (relative to fuselage length and CG guess)?
  • Do incidence angles match your prompt (e.g., horizontal tail at -5 degrees)?
  • Are the surfaces oriented correctly (no flipped normals / inverted sections)?
  • Is symmetry sensible (if using a symmetry plane in CFD)?

3) Run early CFD to compare design directions

Once the shape is plausible, run CFD to identify major pressure trends and interference regions. The attached CFD visualization (surface pressure in Pa) is a good example of what “early” analysis should reveal: loading patterns on the wing and tail, fuselage pressure distribution, and areas where geometry interactions are likely to matter.

What you can learn from early CFD (without pretending it is final)

Early CFD is not a replacement for detailed design CFD, wind tunnel testing, or flight test. It is a way to avoid obvious mistakes early and to reduce the number of designs you carry forward.

Practical early questions to answer:

  • Does the wing loading look reasonable? (spanwise loading trends, tip behavior, large gradients)
  • Is the tail doing what you expect? (incidence effects, tail pressure response, potential authority concerns)
  • Any strong interference zones? (wing-fuselage junction, tail-fuselage junction, etc.)
  • Are there “hot spots” that suggest geometry changes? (local pressure concentrations, unexpected gradients)
  • Does the concept look stable-ish? (not a full derivatives study—just obvious stability/trim red flags)

Where Stallion 3D fits

Stallion 3D is well-suited to this stage because it is designed for fast setup and frequent iteration. In early concept work, you do not want a workflow where every run feels expensive or slow. You want to test more ideas, not fewer.

A practical advantage is licensing: Stallion 3D is cost-effective and does not use a pay-per-run model. That matters because early design is inherently iterative. If you are comparing multiple geometry variants, multiple angles of attack, or small configuration changes, “run metering” becomes friction. Removing that friction is part of moving faster.

Recommended mindset: “cheap learning” before “perfect geometry”

The best use of AI CAD is to accelerate learning. Generate geometry fast, run CFD fast, and only then decide which directions deserve detailed CAD and higher-fidelity analysis. In other words:

  • AI helps you get from idea → 3D model quickly.
  • Stallion 3D helps you get from 3D model → aerodynamic insight quickly.
  • Detailed CAD comes after you have reduced uncertainty and narrowed the design space.

Summary

AI-generated FreeCAD scripting can produce useful concept geometry in minutes. That geometry is not the final answer, but it can be good enough to run early CFD and compare design directions. Stallion 3D is a practical tool for this stage: fast setup, high-accuracy workflow, and cost-effective licensing without pay-per-run friction.

If you are doing early aircraft concepts and want to iterate quickly from rough geometry to meaningful aerodynamic feedback, Stallion 3D is designed for exactly this type of work.

Learn more ➡️ https://www.hanleyinnovations.com

Thanks for reading. 

Thursday, January 15, 2026

Aerodynamics Tools for Rapid Aircraft Conceptual Design

Cessna 210 NLF Wing: Four Models, One Story

This figure shows a simple but useful comparison for a real, non-trivial configuration: a Cessna 210 modified with a NASA Natural Laminar Flow (NLF) wing. The goal here is not “pretty CFD,” but practical validation for conceptual design work.

1) Stallion 3D automatic gridding saves time on real geometries

The Cessna 210 is not an academic “wing-only” case. It has a fuselage, wing-body junctions, tail surfaces, and the usual geometric complexity that shows up immediately when you try to run a 3D analysis.

With Stallion 3D, the gridding step is not a week-long detour. Automatic Cartesian gridding makes it practical to iterate on complex shapes without turning the meshing workflow into the main project.

2) Accuracy matters: Stallion 3D validated against a NASA experiment

The comparison includes experimental results from NASA Technical Paper 2772 (full-scale general aviation airplane equipped with an advanced NLF wing). That dataset provides a grounded reference for lift and drag trends over angle of attack.

In the plots, Stallion 3D tracks the experimental behavior well over the usable range. For conceptual work, this is the point: you want predictions that are directionally correct, quantitatively reasonable, and stable enough to support decisions.

3) Vortex lattice (3DFoil) wing-tail results bracket the trends

A vortex-lattice model (via 3DFoil) is also included for the wing-tail configuration. As expected for an inviscid lifting model, it provides a fast, low-friction reference that helps “triangulate” the physics.

When the VLM curve brackets or parallels the experimental/CFD trends, it increases confidence that the configuration-level aerodynamics are being captured consistently (especially in the pre-stall regime where conceptual sizing happens).

4) Why this matters: validation for conceptual design on complex shapes

Taken together, the four views in the figure (experiment + multiple computational models) provide a practical validation set:

  • Experiment: the anchor point — what actually happened in the tunnel.
  • Stallion 3D: a high-utility conceptual CFD tool that can handle real geometry and produce forces and moments.
  • Vortex Lattice (3DFoil): fast wing-tail estimates that add context and help bound expectations.
  • Cross-comparison: agreement across models is often more useful than any single curve by itself.

This is the workflow I care about: reducing blind spots early. When multiple models (plus experimental data) tell a consistent story, you can move forward faster and spend your time on design choices instead of debating whether the analysis is “real.”

Where this approach is useful

This same validation logic applies beyond the Cessna 210 example. Once the workflow is in place, it scales naturally to:

  • UAVs (wing-body-tail interactions, payload pods, booms, blended shapes)
  • Light aircraft (junction flows, downwash effects, tail sizing, drag budgeting)
  • Sails / marine foils (lift/drag trends, induced effects, configuration comparisons)
  • General projects where geometry complexity is unavoidable and iteration speed matters

Summary

  • Automatic gridding in Stallion 3D keeps complex geometry analysis practical.
  • Results can be validated against experiment (here, a NASA NLF wing dataset).
  • 3DFoil vortex-lattice wing-tail predictions provide a fast bracketing model.
  • Multiple models + experiment = better confidence for conceptual design decisions.

If you’re doing early-stage design and want “good physics quickly” on real geometries, this is the kind of comparison that matters.

Please visit Hanley Innovations for more information ➡️ https://www.hanleyinnovations.com

Saturday, January 10, 2026

First try at AI for Design & CAD with CFD Simulation for Aerodynamics

#AI + Simulation: a 1-hour aerodynamics workflow (Gemini → Copilot3D → Stallion 3D)

Sometimes the fastest way to learn is to let a messy workflow happen… then measure what physics says.
Quick summary
1) I asked Gemini for the “best airfoil shape” → it generated something that looks like a supercritical airfoil.
2) Microsoft Copilot 3D turned that into an STL → surprisingly it became a biplane-ish configuration.
3) Stallion 3D solved the CAD at M = 0.825 within the hour.


Figure: (1) Gemini “best airfoil shape” prompt result, (2) Copilot3D STL interpretation, (3) Stallion 3D pressure visualization + Cp plot.

Step 1 — Asking AI for “the best airfoil shape”

I used a deliberately vague prompt: “draw a picture of the best airfoil shape”. AI doesn’t know your mission requirements (Re, Mach, thickness constraints, lift target, stall margin, structure, manufacturing, etc.), so the output is always going to be a guess—but it’s still interesting what it “reaches for” when asked.

In this case, Gemini returned an airfoil that looks supercritical-ish: thicker mid-chord, flatter upper surface, and a sharper-ish trailing region. Is it “best”? No. But it’s a recognizable design intent: manage transonic pressure gradients and reduce wave drag.

Step 2 — Converting the concept into geometry (and getting a surprise)

Next, Copilot3D generated an STL from the concept image. Here’s the fun part: it didn’t produce a clean monoplane wing. It produced something closer to a biplane / joined-surface interpretation.

This is a good reminder that “image → CAD” isn’t a deterministic pipeline yet. The tool is inferring 3D structure from ambiguous cues—so you can get creative geometry even if you didn’t ask for it. That’s not a failure. It’s a feature (as long as you validate the aerodynamics).

Step 3 — Let physics vote (Stallion 3D at M = 0.825)

Once the STL exists, you can stop debating what the shape “means” and just run it. I brought the CAD into Stallion 3D and solved at Mach 0.825. From there, the workflow becomes familiar: surfaces, pressure/Cp trends, and whatever integrated outputs you care about (lift, drag, moments).

The point isn’t that the AI created a production-ready aircraft. The point is that you can now move from an AI sketch to a solvable geometry to CFD-based insight fast enough to iterate.

What this workflow is (and isn’t)

  • It is: a rapid way to generate “candidate geometry” when you’re brainstorming.
  • It is: a quick filter—physics can reject bad ideas early, before they waste days.
  • It isn’t: an optimizer, a certification path, or a substitute for requirements-driven design.
  • It isn’t: proof that AI “understands aerodynamics.” It’s proof that AI can accelerate the setup—and CFD can validate the result.

Try your own workflow

If you want to run this experiment yourself, keep it simple:

  1. Ask an AI for a concept (airfoil, wing, fairing, inlet—anything).
  2. Convert to STL (expect surprises).
  3. Run a quick CFD sweep (one condition is enough to learn something).
  4. Decide what to keep, what to change, and repeat.
(If you’d like, send me your STL + flight condition and I’ll tell you what I’d look at first: Cp trends, shocks, separation risk, and the integrated forces/moments.)

Thursday, December 11, 2025

Stallion 3D for Fast Aerodynamics Design Tradeoffs (no cloud, no CFD team)

Using Stallion 3D for Fast Design Tradeoffs


One of the realities of engineering design is that many decisions are made before a detailed CFD campaign ever makes sense.

Landing gear placement, strut geometry, fairings, brackets, pylons, and similar components all introduce aerodynamic penalties. The question is usually not “what is the final answer?” but rather:

  • Is configuration A better than configuration B?
  • How much drag or side force did this change introduce?
  • Is this direction worth pursuing further?

This is where Stallion 3D fits into the workflow.

Design tradeoffs without a heavy CFD process

The examples shown compare two landing gear configurations using Stallion 3D. The goal is not high-end turbulence modeling or mesh tuning. The goal is fast, consistent comparison between design options.

With Stallion 3D, design engineers can:

  • Evaluate component-level tradeoffs early
  • Make informed decisions without waiting on CFD specialists
  • Avoid cloud compute costs and pay-per-run models

The solver and grid generation are automatic and repeatable, so changes in forces and moments reflect geometry changes, not meshing differences.

What Stallion 3D provides in this workflow

  • Consistent automatic grids across multiple design variants, enabling meaningful A/B comparisons.
  • Subsonic, transonic, and supersonic capability for evaluating components across a wide flight envelope.
  • Designer-friendly workflow with no need to consult CFD experts for every iteration.
  • Direct, interpretable outputs, such as CD_gear_2 > CD_gear_1.
  • No pay-per-run cost for quick conceptual analysis.

Where this fits in the bigger picture

Stallion 3D is not intended to replace detailed CFD at later stages. Instead, it helps narrow the design space early so higher-fidelity tools are applied only when they add value.

For many projects, this reduces iteration time, cost, and dependence on limited CFD resources, while keeping decisions grounded in physics.

If you have questions about using Stallion 3D in your design process, feel free to reach out.

Learn more ➡️ https://www.hanleyinnovations.com/stallion3d.html

Wednesday, October 29, 2025

Aerodynamics of the NASA QueSST X-59 Quiet Supersonic Transport

📽️ Watch the YouTube Video

X-59 Quiet Supersonic Transport Study Using Stallion 3D

I ran a new quiet-supersonic study at Mach 1.45 and 55,000 ft using the built-in atmosphere tables and Cartesian solver in Stallion 3D. The goal was to reproduce and understand the kind of pressure distribution seen in the NASA X-59 QueSST demonstrator, which recently completed its first flight. The idea is the same: manage the shock pattern so the ground hears a soft “thump” instead of a sonic boom.

Shock Management Along the Nose

The simulation shows a controlled series of small compressions marching down the forebody rather than one big, coalesced shock. That’s exactly what quiet-supersonic shaping is about—spreading the pressure rise (Δp/Δx) gradually so the far-field signature becomes a sequence of gentle steps instead of a single N-wave.

At these flight conditions, the distributed shock train is similar to what the X-59 team reported during their low-boom configuration tests. It’s encouraging to see Stallion 3D’s Navier–Stokes solver naturally produce the same kind of flow behavior on a simple Cartesian grid.

Canopy and Inlet Shoulder Interaction

Right behind the cockpit, a red-blue compression and expansion pattern forms where the fuselage grows into the wing root. This region is a classic challenge in supersonic design—where cross-section growth and lifting surfaces meet, shocks can thicken and contribute to secondary noise.

It’s good to see that Stallion 3D’s refinement zone resolves these local gradients clearly, without any hand-built body-fitted grid. The automatic cell concentration gives an accurate look at how geometry transitions affect both drag and acoustic signature.

Aft-Body and Tail Effects

The aft wing and tail surfaces are doing real aerodynamic work. The pressure remains mostly clean, but there are still distinct compression and expansion regions being shed downstream.

In low-boom design, the rear shaping is as important as the nose. The aft body determines how the pressure signature closes—the part that controls how the sonic waveform ends. That’s the part that often separates a “thump” from a “bang.”

Refinement Zone and Solver Performance

The local grid density around the aircraft shows that the refinement box is working exactly as intended. It captures oblique shocks and shear layers efficiently, even at Mach 1.45, without requiring a fitted mesh.

From a numerical standpoint, this confirms that Stallion 3D’s Cartesian method is practical for supersonic concept studies—especially for early X-59-style configurations or general quiet supersonic transport layouts.

Realistic Flight Condition

The run used true high-altitude conditions (55,000 ft, Mach 1.45) from the built-in atmosphere model. These are the same conditions typically quoted for quiet-supersonic cruise tests and community response research under NASA’s QueSST program.

That realism matters for both acoustics and aerodynamics. At these pressures and densities, thin, swept lifting surfaces behave differently than they do in low-altitude transonic tests.

Next Steps

  • Extract the far-field pressure trace along the ground track (Δp vs. time) to evaluate perceived loudness.
  • Quantify lift, drag, and moment coefficients (CL, CD, CM) to separate wave drag from viscous effects.
  • Run sensitivity tests by shortening the nose or modifying canopy cross-section to see how it reshapes the shock train.

Conclusion

This quiet-supersonic run demonstrates what Stallion 3D does best—showing real aerodynamic detail from first principles without external meshing or post-processors. The solver’s ability to capture distributed shocks, canopy interactions, and aft-body effects all in one pass makes it an effective tool for early design of low-boom aircraft like the X-59 QueSST.

It’s not about pretty colors; it’s about credible data at real flight conditions. The results show a clean, believable Mach 1.45 solution with controlled shock structure—the kind of solution that points the way toward practical, certifiable overland supersonic transport.

Learn more ➡️

Please visit https://www.hanleyinnovations.com for more information.

Friday, October 24, 2025

Multi-element Airfoils analysis with arbitrary shapes: Learn more about the best airfoils tools

Do Fish Swim Like Multi-Element Airfoils?

In nature, a school of fish moves as a coordinated system. Each fish swims in the wake of another, taking advantage of pressure differences and induced flows that reduce drag and save energy. It’s a clean example of fluid mechanics at work — and not too different from how engineers design multi-element airfoils for high lift.

The image above shows a simulation created from fish-shaped outlines. The shapes were first traced as simple drawings and then captured using Airfoil Digitizer. Airfoil Digitizer lets you turn almost any outline — hand-drawn, scanned, or imported — into an analysis-ready shape. You are not limited to NACA airfoils or standard sections. If you can sketch it, you can analyze it.

After digitizing the shapes, I placed them together and ran a potential flow solution in MultiElement Airfoils. This solver computes the velocity and pressure field around multiple bodies at once, and shows how they interact. The colored contours represent pressure: blue for low (suction) regions and red for higher pressure. You can see how each “fish airfoil” changes the flow around its neighbors, very much like the interaction between a slat, a main wing, and a flap.

This is the interesting part: even with playful shapes, the physics is still there. You get wake shielding, suction peaks, and local acceleration in the gaps. That’s the same family of effects we care about in real applications — multi-element wings, hydrofoils, propeller/wing interference, and UAV control surfaces working close together.

The workflow here was:
1) Sketch or outline a shape
2) Capture it with Airfoil Digitizer
3) Arrange multiple elements and solve the flow in MultiElement Airfoils
4) Visualize pressure and interaction

It’s a fun demonstration, but also a serious one. Airfoil Digitizer gives you full control over the geometry. MultiElement Airfoils lets you study how multiple lifting surfaces behave together, not just one at a time. Together they make it easy to explore ideas, test concepts, and see the aerodynamics before you ever build a model.

Visit ➡️ https://www.hanleyinnovations.com

Best regards,
Patrick

Thursday, September 25, 2025

CFD and Aerodynamics of a Blown Wing for eSTOL, STOL & eVTOL Aircraft Design and Analysis


This guide condenses the video transcript into a short, actionable tutorial. Follow the steps below to replicate the workflow shown in the video.  Applications include eSTOL, STOL and eVTOL aircraft.

Tutorial Steps (from Transcript)
  1. Hello and welcome to Hanley Innovations. Today we will outline how to set up actuator discs in Stallion 3D to implement a blown wing concept.
  2. First, we create the wing in Stallion 3D using the built-in geometry tools. This wing has a span dimension of 4 m and a cord of 1 meter.
  3. It uses a NACA 4412 from the built-in library. Next, we enter the actuator discs parameters.
  4. For all four, we set a force of 500 Newtons. We copy the first disc and set the Y center to minus 0.75.
  5. Next, with the same copy, paste a discs with Y centers of 0.25 and minus0.25 respectively to complete the propulsion distribution. Next, set up the CFD using 1 million cubes with the initial X, Y, and Z settings of 2, 2 and two.
  6. Use the default Navier Stokes solver. Then click the generate grid solve flow menu.
  7. Stallion 3D will automatically generate the grid and solve the flow. The results show the effects of the disc's prop wash over the wing and in the wake.
  8. We can now compare the lift force of the unpowered wing to that of the blown wing. The unpowered wing has a lift force of 24 lb in the 20 m/s flow field.
  9. The blown wing has a lift of 70.8 lb. 
  10. Until next time, thanks for watching.

 For more information, please visit https://www.hanleyinnovations.com

Wednesday, September 10, 2025

Quick and Accurate UAV Aerodynamics Analysis using Stallion 3D

Solved by Default 🛠️ — Import • Mesh • Solve in Stallion 3D

A quick walkthrough by Dr. Patrick Hanley (Hanley Innovations)

Watch: Solved by Default — Stallion 3D

Click the image to watch the short demo on YouTube.

In this quick demo, we import a drone STL, let Stallion 3D auto‑configure the CFD boundaries and domain sizing, pick a sensible default mesh, and run the solver—going from geometry to pressure contours in minutes.

What the video covers

  1. Import geometry via Design → Import STL (ASCII or binary). Set units (e.g., meters) and position/orientation.
  2. Automatic domain & boundaries: Stallion 3D sizes the CFD box and boundary conditions from the STL—so you don’t have to hand‑tune the grid extents.
  3. Optional geometry quality check: If your STL has gaps/holes, run the quick check to mitigate issues before grid generation.
  4. CFD setup with smart defaults: choose a mesh density (Quick, Medium, Large; example shown: ~1 M cells). The default solver and domain dimensions are good starting points.
  5. Generate & solve: Start meshing and the flow solution in one click.
  6. Visualize results: View the 3D geometry and pressure distribution; add legends/units (Pascals) with the graph options.

Why this workflow is fast

  • No manual domain sizing—it’s solved by default.
  • Defaults that “just work” for early design checks.
  • Applies across subsonic, transonic, and supersonic regimes for rapid concept iteration.
Watch the short demo

Prefer reading? Reply with questions—happy to help you try this on your geometry.

© Hanley Innovations • This email is informational. Video & demo: Dr. Patrick Hanley.

Friday, August 22, 2025

What Is a Multi-Element Airfoil? Aircraft, Cars & Design Explained


What Is a Multi-Element Airfoil?

How they work for aircraft takeoff/landing, motorsports downforce, 

and how they are designed by engineers.

Quick definition

A multi-element airfoil is a lifting surface made from two or more cooperating profiles—typically a main element plus leading-edge slats and/or trailing-edge flaps. By carefully positioning the elements (gaps, overlaps, and deflections), designers dramatically increase lift (for aircraft) or downforce (for cars) at low to moderate speeds without making the wing excessively large.

Why multi-element airfoils work

  • Circulation & camber boost: Slats and flaps increase effective camber, strengthening circulation and lift.
  • Slot effect (boundary-layer control): The gap between elements jets high-energy air over the next element, delaying separation and letting the system reach higher lift coefficients before stalling.
  • Fowler motion: Many flaps translate rearward and rotate, increasing wing area and camber simultaneously.
  • Load sharing: Each element carries part of the pressure jump, reducing peak adverse gradients on any single surface.

In practice, a single-element airfoil might achieve a CL,max around ~1.4 (order of magnitude), while a well-designed multi-element system can exceed ~2.5–3.0+ depending on geometry, Reynolds number, and deflection schedule. (For cars, think of “negative lift” or downforce rather than positive lift.)

Where you see them in the real world

Jet airliners (takeoff & landing)

Airliners need huge lift at low speeds to operate from practical runways. On approach and takeoff, they deploy leading-edge slats and multi-segment trailing-edge flaps to raise CL,max, allowing lower approach speeds, shorter distances, and improved safety margins. In cruise, devices retract to reduce drag.

Business jets, turboprops, and STOL aircraft

Many business jets and turboprops use slats and flaps for field performance. Short-takeoff-and-landing (STOL) aircraft do the same, sometimes adding devices like fences, cuffs, Krueger flaps, or blown flaps to energize flow and improve controllability near stall.

Uncrewed aircraft & model aviation

UAVs benefit from high-lift systems for heavier payloads or shorter fields. Multi-element tails or deployable flaps are common on fixed-wing drones that must launch and recover in tight spaces.

Motorsports & performance cars

Racing wings often use two or more elements (plus Gurney flaps) to produce large downforce at modest speeds, improving grip in braking and cornering. Rules usually cap element count and geometry, so careful design of slot gap, overlap, and flap angle is crucial to hit the aero targets without stalling the wing.

Key design choices

  • Architecture: How many elements? Slat + single flap, double-slotted flap, or more?
  • Gap & overlap: Tiny changes (millimeters) in the slot can make or break high-lift performance.
  • Deflection schedule: Angle and translation vs. speed/phase (takeoff vs. landing) or, for cars, vs. ride height/attitude.
  • Reynolds/Mach effects: Section choice and flap geometry depend on size and speed regime.
  • 3D integration: Wing twist, endplates/fences, tip effects, and flap track fairings all matter.
  • Structures & mechanisms: Added complexity, weight, and maintenance vs. performance gains.
  • Noise & certification: For aircraft, aero-acoustic considerations can drive geometry and schedules.

A practical workflow for designing multi-element airfoils

  1. Define the mission: Field length, stall margins, approach/takeoff speeds (aircraft), or target downforce/drag window (cars).
  2. Choose a baseline section: Start with a main element suited to the Reynolds number and thickness needs.
  3. Select devices: Slat type and size; flap type (plain, split, single-slotted, double-slotted, or Fowler); Gurney height.
  4. Set initial geometry: Gap/overlap and hinge lines; add mechanical constraints for real deployable hardware.
  5. Analyze 2D performance: Sweep angles of attack and device deflections to map CL, CD, Cm, and stall behavior.
  6. Scale to 3D wing/car installation: Include spanwise effects, endplates/fences, and local ground effect (cars).
  7. Optimize the schedule: Create “takeoff” and “landing” (or “low-speed” and “high-speed”) settings; validate against constraints.
  8. Iterate with CFD and tests: Refine details such as slot curvature, fairings, and sealing strategies.

Design faster with Hanley Innovations software

Hanley Innovations provides tools that streamline multi-element airfoil and wing design—from early concepts to practical, test-ready geometries:

  • MultiElement Airfoils – Rapidly configure slats, flaps, gaps, and overlaps; evaluate high-lift performance across deflection schedules. Ideal for airliner high-lift studies, STOL concepts, UAVs, and motorsports wings.
  • 3DFoil – Analyze full wings and tail combinations quickly, explore stability derivatives, and build trim maps that incorporate your high-lift settings.
  • Stallion 3D – Move to full-3D CFD when you need richer flowfield details (pressures, forces/moments, and flow features) on real geometries, including multi-element systems and car wings.

Ready to accelerate your high-lift or downforce project?

Visit Hanley Innovations to explore MultiElement Airfoils, 3DFoil, and Stallion 3D.

FAQ

How many elements are “too many”?
Diminishing returns set in as mechanical complexity, drag, and sensitivity increase. Most practical systems use one slat and one or two flap elements; motorsports rules often limit element count explicitly.

Do Gurney flaps count as an element?
They’re typically treated as a device on an element rather than a full element, but they can significantly boost lift/downforce at the right Reynolds numbers.

What’s the most sensitive parameter?
The slot (gap and overlap) and the deflection schedule. Small tweaks here can change peak performance and stall character.

© Hanley Innovations • Tools and methods here are for educational guidance; always validate with appropriate analysis and testing for your application.

Sunday, August 10, 2025

Rocket Aerodynamics Video Tutorial

🚀 Rocket Aerodynamics — From STL to Flight-Ready Insights

Altitude is great—but control and stability win flights. In this video, I show how to take your rocket’s STL file and run a complete CFD analysis in Stallion 3D so you can predict side force, spin tendency, and CP shift before launch.

What’s inside

  • Import your STL from OpenVSP, Tinkercad, or OpenRocket
  • Set realistic flight conditions: Mach, altitude, angle of attack
  • Run the solver to get surface pressure, side force, yaw moment, spin tendency, and CP shift

Why it matters

Estimates for CG/CP are a start, but they miss critical effects—fin misalignment, transonic bumps, and asymmetric forces. Stallion 3D gives you the full aerodynamic picture so launches are straighter, faster, and more reliable.

Smarter launches start here. — hanley@hanleyinnovations.com