Saturday, July 28, 2012

Ground effect experiment: Try this ...

Slide an old or unwanted CD across a desk, table or smooth floor. With the shiny side down (read/write side) the CD will slide a long distance in ground effect.  With the shiny side up, the CD will tend to stick to the surface.

Why?

The first thing to notice is that the label side of the CD is completely (well almost) smooth and flat.  While the read/write side has a notch (ring) near the center hole of the CD (where the plastic is transparent) on an otherwise smooth surface.

I performed a 2-D analysis of the CD airfoil (at the center-line) using Hanley Innovations' MultiElement Airfoils software package. The notch was set to a height of 0.0125 inches and the CD was placed 0.025 and 0.0375 inches off the ground.  The speed was set to 10 feet/sec and the Euler code was used to model the flow.

Grid generated automatically using MultiElement Airfoils.

The following is the results for the CD with the read/write side up (Cl = -0.105).  The bottom line represents the ground plane:

With the read/write side up.  The computed lift coefficient was -0.104 with h=0.025 in

Velocity distribution of flow near the notch (bottom line is the ground plane).

The negative lift coefficient or down-force caused the CD to stick to the surface.  It will make a great race-car in this mode.

Next, the flow, with the CD read/write side facing down, was computed in MultiElement Airfoils.  This time, the lift coefficient was +0.105

With the read/write side down, the lift coefficient was +0.105 with h=0.0375 inches.

Velocity distribution of the flow near the notch.

The positive lift coefficient caused the CD to lift free from the friction on the floor and provided a longer journey.  This disc models a WIG (wing in ground effect) or Ekranoplan in this mode.

These results suggest that the notch-ring near the center of the CD is the reason for the wing-in-ground effect behavior.  

Do your know of other simple ground effect experiment?

Thanks for reading and best wishes.

Patrick
http://www.hanleyinnovations.com

Tuesday, July 10, 2012

Five Reasons for 3D Aerodynamics

Are you in the process of designing a new aircraft, sailboat, or automobile.  3D analysis can play an important part in the design process.  Please consider 5 reasons (not necessarily definitive) to use 3-D aerodynamics early in your design process.

5.  Your design should not look like your analysis & design tool.  If you are too comfortable with 2-D analysis eventually your real-world designs will all resemble airfoil shapes.  A good 3-D design and analysis tool should render and analyze the exciting concepts that resides within your creative mind.  Feel free to throw caution to the wind and reap the rewards of your imagination.

Stallion 3D analysis of a human in the wind.


4.  An airplane is a 3-D object and is usually designed to be stable in flight.  Good stability in flight requires accurate computations of the location of the aircraft neutral point,  the size of the vertical tail (for lateral stability) and effects of the wing's dihedral angles.

Stallion 3D CFD Analyis of the SeaBee Aircraft from NASA VSP Hangar.

3.  Like humans, air prefers to use the "extra" third dimension to get out of the path of a speeding car.  If you wish to determine the down-force on a car wing in ground effect, two-dimensional analysis can provide much insight into the airfoil shape and angle of attack.  However, in 3D the air has a tendency to flow around wings of low aspect ratio that are too close to the ground.

MultiElement Airfoils analysis of a NACA 2412 wing in ground effect.

The figure below shows the same airfoil shape used on a wing of aspect ratio two.  The downforce on this wing will be smaller than its 2-D counterpart.  Use 3D aerodynamics to develop new and exciting methods to force the air through wings shapes that will capture the maximum downforce.

Stallion 3D analysis of Aspect Ratio 2 Wing in Ground Effect

2.  3D aerodynamics can be used to model the structure and planforms of wings that decrease drag (such as wing with winglets), increase downforce (end plates) or enhance the integrity of the structure (joined wings). 


ESwift Aircraft from VSP Hangar Analyzed in Stallion 3D.

1. Several year ago, 3D analysis was costly and difficult. Now, 3D aerodynamics is easy and cost effective.  My laptop computer is fast enough to analyze the 3-D Euler/Navier-Stokes equations (and so is yours).  Take advantage of modern CFD codes such as OpenFoam, Caedium, grid generation software such as Pointwise or  Stallion 3D for a complete aerodynamics conceptual analysis to enhance your creative process.

More information can be found at http://www.hanleyinnovations.com/stallion3d.html

How can you take advantage of 3-D analysis?

Thanks for reading.

References:Stallion 3D:  http://www.hanleyinnovations.com/stallion3d.html
Caedium: http://www.symscape.com/product/caedium
Pointwise: http://www.pointwise.com/
OpenFoam:  http://www.openfoam.com/

Friday, June 1, 2012

Analyze an Airplane using CFD with a High Level of Confidence

There are many reasons to make changes to the airframe of an airplane.  These include improvements to the airfoil to reduce the profile drag and increase lift;  wing tip modifications (winglets)  to reduce induced drag;  addition of stores and external components such as landing gear covers;  increasing load carrying capacity or adding surveillance equipment.

Aerodynamics Analysis based on CFD can Provide Efficient Model Screening

Making changes to an airplane configuration can be expensive and sometimes dangerous.  One method to reduce the expense is to test the proposed configurations in all possible modes of operations.  Testing can be time consuming and has a natural enemy called "the deadline".  Aerodynamics analysis methods based on computational fluid dynamics (CFD) methods can reduce testing time by rapidly screening models and pre-selecting only the promising ones for further testing (wind tunnels, scale models & flight testing).


Stallion 3D Automatic Gridding Dramatically Increases the Number of Models
That can be Tested Before the Deadline

If the goal of the design is to increase the load carrying capacity of the airplane, then each design iteration should be tested over a range of angles of attack to determine lift and the angle of attack for maximum lift.
Good Understanding of the Results can be Gained by Studying
Increasingly Complex  Aerodynamic Models.

A good way to gain confidence (even in conceptual studies) is to study increasingly complex analytical and geometric models.  The above graph starts with an airfoil analysis (using VisualFoil 5.0) and escalates using MultiSurface Aerodynamics (vortex lattice model for wing-tail) and Stallion 3D (Euler model for analyzing the full complex geometry).

MultiSurface Aerodynamics is an Interactive Software Based on the Vortex Lattice Method
for Quick 3-D Analysis of Complex Systems of  Lifting Surfaces.

If your goal is to add equipment or payload capacity to the aircraft, then you must find the neutral point (or aerodynamic center) for each proposed model.  The neutral point of the aircraft is defined as the position where Cm, the pitching moment coefficient, does not vary with a change in angle of attack (or dCm/d(AoA) = 0).  To get a good understanding of this, one can plot Cm taken about a number of locations and plot each location as a function of angle of attack.  To gain confidence in your analysis tool, you should use experience and a variety of methods to arrive at comparable results.

Cm vs AoA Taken About Various Positions from the Aircraft's Nose.  The Stallion 3D Model
Compares Well with the MultiSurface Aerodynamics (MSA) Model.

The above graph shows that the neutral point is located about 3 meters from the nose of the aircraft. Here the slope of the Cm vs. Angle of Attack curve is zero.   Ahead of the neutral point (0 < x < 3) m, the slope of the moment is negative.  This means that if the center of gravity (CG) is located in this region,  an increase in angle of attack (due to a gust for example) will be righted by an opposing moment about the CG.  However, if the CG is located aft of the neutral point (3 < x < 8) m,  then an increase in the angle of attack will be exacerbated by an enhancing moment action about the CG (this is not stable).

Another item to note is that as the CG is placed increasingly ahead of the neutral point, the restoring moment becomes larger.   The distance between the CG and neutral point is known as the static margin.  Increasing the static margin increases stability, however, the righting moment reduces the ability to control the aircraft.  The design goal is to provide good stability with smaller control surfaces.

Studying the moment coefficients shows that in its current configuration, our aircraft will fly at an angle close to the zero-lift angle of attack.  This is because the horizontal tail in the model (taken from NASA's Vehicle Sketch Pad program) is at zero angle of attack.

The Horizontal Tail Uses a Symmetric Airfoil at Zero Angle of Attack

To change the trim angle of the aircraft, we can control the angle of the horizontal tail surface. We assume that the CG is located 2 meters from the nose of the aircraft. The figure below shows that the aircraft will fly at angles of attack of -3 degrees, 0.7 degrees, 4.4 degrees for tail angle setting of  0.0, -5.0 and -10.0 degrees respectively.


MSA Analysis to Determine the Trim Angle of Attack of the Wing-Tail Model.

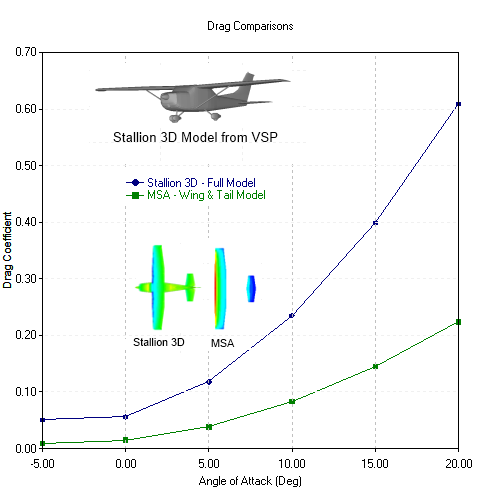
The fuselage shape and external components (stores and landing gears) can increase the drag of the airplane.  The figure below compares the pressure drag computed by Stallion 3D against the profile and induced drag of the wing-tail configuration computed using MSA.


Drag Comparison of Two Models

The pressure drag of the fuselage, wing and struts adds to the total drag of the wing and tail. The goal of the design is to move the blue curve towards the green one.  The green curve is the best that can be due given the wing planform shape and airfoil selection.

The results were complied after executing 6 cases in Stallion 3D with each run containing upwards of 700,000 cells.  The the computations required about 8 to 10 hours per case on an HP laptop (2.4 gigahertz processor).  The Stallion 3D floating licenses allow users to run the program on all available computers and processors. The time to set each case in Stallion 3D took less than one minute.  The grid generation was automatic.

Stallion 3D was run at 6-different Angles of Attack for this Study


The cases ran in MultiSurface Aerodynamics were executed in less than one minute.

The above exercise involved longitudinal static considerations. We can repeat the exercise for lateral stability considerations. The above procedure can be carried out for design iterations and we could gain a good understanding of the behavior of the design before it advances to further testing.

Related Reading:
1. How to Enter and Analyze a Wing (in Stallion 3D): http://hanleyinnovations.com/winganalysis.pdf

2. NASA Vehicle SketchPad Page:  http://vspmanual.webs.com/

3. Cessna 172 Performance Analysis by Temporal Images:   http://www.temporal.com.au/aero.htm

4. Aerodynamics of a Circular Planform Airplane:  http://www.eng.auburn.edu/organizations/AIAA/files/papers/2008/masters/Recktenwald_2008.pdf


Please email or call me at (352) 240-3658 if you have any questions.

Thanks for reading.

Sunday, May 27, 2012

Analyze, Print & Export NACA Airfoils

A limited edition version of VisualFoil 5.0 is now available for the price of $69.
 
 
This version allows the analysis of NACA 4, 5 and 6-digit airfoils using the built-in library. In addition, the airfoils can be modified within the program and exported to ASCII (text) or .dxf file formats.
 
VisualFoil 5.0 uses a linear strength vortex panel method coupled with boundary layer analysis solver  to compute lift, drag and moment coefficients for subsonic (Prandtl-Glauert correction) and incompressible flows past airfoils. The stall model allows the estimation of the angle of maximum lift. Graphs of Cl vs angle of attack, Cl vs Cd and other curves are available within the software and can be exported to external reports.


More information about VisualFoil can be found at: http://www.hanleyinnovations.com/vfnaca.html
 
VisualFoil 5.0 is excellent for:
  • accurate airfoil analysis and computing lift, drag and moment coefficients
  • NACA 4, 5 & 6-Digit Airfoil library 
  • student projects (aircraft, wind energy, hydrofoils)
  • an inexpensive airfoil reference tool
  • classroom demonstrations
  • printing airfoils templates on a Windows supported printer
  • exporting accurate representations of airfoils to .dxf files  
The NACA-Version of VisualFoil requires a PC or Laptop running Windows XP, Vista or Version 7. The purchase price is $69 US.

Please use the following link to purchase the software.

http://www.hanleyinnovations.com/vfnaca.html

Do not hesitate to contact me at (352) 249-3658 if you have any questions.

Thanks for reading.

Monday, May 21, 2012

Setting Sails

It is important to realize that sails are wings and they often act like wings (this applies to almost any sail and not just rigid wing sails now popular in the America's Cup race). Therefore, when it is required to optimize the sail settings for a specific boat, we can rely on our knowledge of wing aerodynamics and our bag of accumulated tricks (experience & tools) to do an efficient job.

The primary goal of sail optimization is to increase the lift (for a good drive force component) and reduce the drag (stability must be maintained during the process).  Sail optimization is a repetitive job.  This is because, like wings, the drive force of the sail in up-wind sailing depends on the apparent wind vector (direction and magnitude), the planform (area & aspect ratio), the camber (flat or curved cross sections), the gap between the fore and main sails, the mast and other parameters (such as height above the deck, hull shape, etc.).

Stallion 3D Simulation of flat thin sails. The graphs shows pressure.

A good design does not simply mean infinite aspect ratio to reduce tip vortices (tip vortices increase drag as seen in above picture).  The heeling moment will be too big (unless, of course, you have this installed on your boat).  Large camber or deeper sails can increase the drive force, however, stability and drag from supporting underwater devices (keel and rudder) can erode this advantage. To obtain the optimal (or best we can do at the moment) specifications for a particular sail, we must test our design iterations against a number of possible sailing conditions. 

Stallion 3D Simulation of cambered thin sails. 

Deadlines are the natural enemy of testing and optimization.  Experimental setup and testing in a wind tunnel can be time consuming and costly (and might even require a minor in wood carving).  Wind tunnel and tow-tank test can be made more efficient and cost-effective only if the most promising designs are tested prior to making the final decision.

Stallion 3D Simulation of cambered thin sails with a larger angle between jib and main sail.

Computational methods can be used to test conceptual and preliminary design ideas.  However, a good understanding of the assumptions used in a particular method is required to get useful information to test in the wind tunnels and water tanks.  What is the difference between 2D sections, vortex lattice, panel methods, Euler/Navier-Stokes methods? They are all useful.   Knowing the answer and how to apply the various concepts in a concerted manner can speed up your upwind sail to the best design.

No sail optimization study is complete without the consideration of the underwater systems (keel, rudders and other appendages). Like sails, keels and rudders are wings and also behave as wings.  The goal to provide stability and lateral resistance can result in drag (induced and profile).  Also, an efficient keel for up-wind sailing can be terrible otherwise.  In short, sail and keel/rudder analysis are coupled and equal partners in sailboat optimization.

Stallion 3D simulation of a keel and bulb.

In the area of aerodynamics conceptual design, a lot of nautical mileage can be quickly covered with a tool that has a built-in set of realistic physical assumptions, automatic grid generation and cost effective and readily available computing platform.  Stallion 3D can be deployed on an ordinary Windows PC, run in multiple directories to take advantage of multi-core processing and efficiently and accurately analyze the most difficult models.

Stallion 3D simulation of sails and hull (3D model from http://turbosquid.com).
Graph shows surface speed in m/s.

More information can be found at http://www.hanleyinnovations.com/stallion3d.html.  The cost of a 3-months lease of Stallion 3D is $895.

Thanks for reading. 
Do not hesitate to email or call me at (352) 240-3658 if you have any questions.

Tuesday, May 15, 2012

Faster Target Drones

Transonic jets are not easy targets and valuable training and experience can be gained by using faster drone aircraft as targets during training. 

Transonic & supersonic jets make very expensive drones. One solution is to use outdated airplanes as targets.  However, retrofitting these airplanes with new equipment can be equally expensive especially in light of their inevitable fate.

A cost reducing solution is to modify existing target UAVs so they can efficiently fly at higher Mach numbers with relatively inexpensive propulsion systems.  This requires drag reducing techniques at the regime of flight in the neighborhood of the drag divergence Mach number aka Mdd.

Stallion 3D Simulation of UAV at M=0.95

Drones designed for subsonic flight look and behave differently than those designed for supersonic flight.  A proven method for increasing the Mdd is to sweep back the main wings.  However, if an existing UAV is redesigned with a swept wing, the stability and flight characteristics of the aircraft will change and the cost of the modifications can increase.  

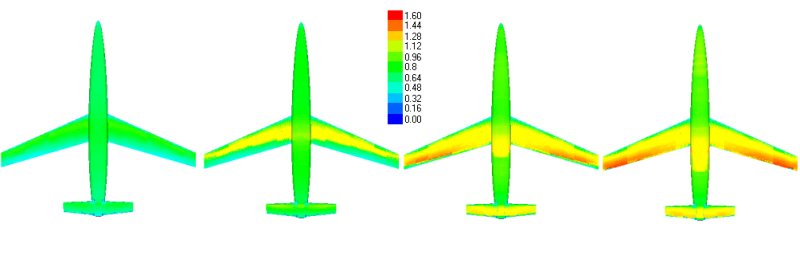
Stallion 3D was used for a quick design study with  four  different Mach numbers near Mdd and two similar UAVs to test the concept of airfoil modification as apposed to sweep to improve the aircraft performance at high transonic Mach numbers.  

Grid generation for the aircraft was automatic and the total set of calculations (8 separate cases) was completed in under 12 hours on a 4-core laptop computer running Windows 7.

Existing UAV System with Modified Airfoil at Mach number of 0.7, 0.8, 0.9 & 0.95.


Existing UAV System with Modified Wing Sweep at Mach numbers of 0.7, 0.8, 0.9 & 0.95.

Drag Divergence for Modified UAVs

The studies show that as far as Mdd is concerned,  a cost effective airfoil modification option can be used to increase the efficiency of a drone aircraft near Mdd and it can be effective as swept wings.  In addition, this aircraft can also be more efficient at lower speeds.

This is an example of valuable information than can be quickly obtained due to the unique algorithm contained in Stallion 3D.  The software can be used to compute lift, drag, moments and stability derivatives for your unique aircraft shape at subsonic, transonic and supersonic speeds.  Grid generation is automatic and the setup of a complete aircraft configuration can take less than one minute.

How would you use Stallion 3D to quickly solve your  aircraft modification problems?

For more information, please visit http://www.hanleyinnovation.com/ or call us at (352) 240-3658.

 Please visit http://www.hanleyinnovations.com/stallion3d.html for more information about Stallion 3D.  

Thanks for reading. 


Wednesday, May 9, 2012

Stallion 3D Comes to The Aerodynamics ClassPack

Every student in your class (or member of your small business group) can have a copy of the Aerodynamics ClassPack on their notebook computer for the entire year!

ClassPack is a yearly class/group license of our software suite consisting of  Stallion 3D, MultiSurface Aerodynamics, MultiElement Airfoils and VisualFoil Plus. Each module in ClassPack has proven accuracy and utility in both the professional and academic worlds.


The advantages of ClassPack include:
  • engaging content for lectures and labs
  • independent student activities
  • complete software packages (no need to purchase extra pre & post processing tools)
  • engineers and students do not need to have advanced aerodynamics or computer programming skills
  • accurate solvers for realistic project and lab experiments
  • interactive visualizations for engaging aerodynamics presentations and lectures
  • standard graphs (as you will find in text books or reports) & analysis for reports and capstone year end projects
  • design interface for international design competitions
  • ideally suited for fulfillment of design credits
  • already used in industry for aerodynamics conceptual analysis & design
Under the ClassPack license, all engineers, faculty, staff & students involved with a specific small business group or academic class will be able to access the software suite under a single class password.
The software can be installed in the classroom,  engineer or faculty offices, group members and students' PCs or notebooks and in labs associated with the class.


Stallion 3D race car simulation. Graph show surface velocity in m/s.

The Aerodynamics ClassPack Suite is ideally suited for:
  • aerodynamics conceptual analysis and design
  • introductory courses in aerodynamics and fluid dynamics
  • intermediate courses covering flow fields, airfoil analysis, 3D wing analysis & design, compressible flows & boundary layers and high lift devices
  • advanced courses covering 2-D panel methods, 3-D vortex lattice methods and finite volume CFD methods
  • senior projects & design-build-test competitions
  • consulting projects
  • aircraft, marine and automobile design and analysis
  • transonic and supersonic aircraft design and analysis

Stallion 3D Simulation of NASA CRM, 800K+ cells, 5% error in Cl/Cd (Cl=0.58).

The following modules are available in our class pack:
The introductory price for one year of the Aerodynamics ClassPack is $2,995.  Please click here to purchase.

For more information, please visit http://www.hanleyinnovations.com/classpack.html or call us at (352) 240-3658.
Please visit our YouTube channel at: http://www.youtube.com/user/hanleyinnovations?feature=guide